
Page 285 - HIVMED_v21_i1.indb
P. 285
Page 3 of 8 Original Research
percentages. Continuous variables were compared by using Results
the Wilcoxon rank-sum test as data were asymmetrically
distributed. Categorical variables were compared by using Descriptive data
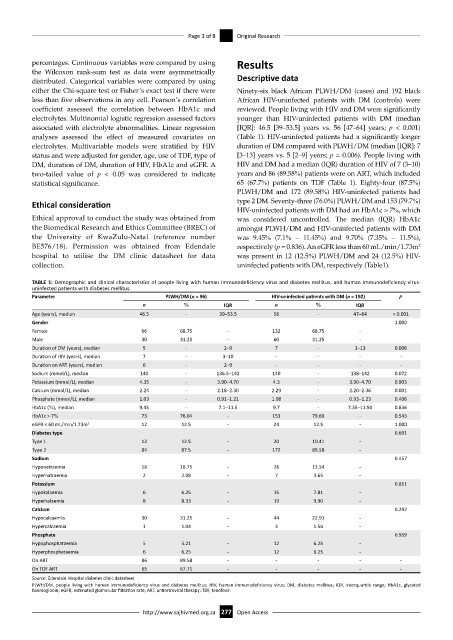
either the Chi-square test or Fisher’s exact test if there were Ninety-six black African PLWH/DM (cases) and 192 black
less than five observations in any cell. Pearson’s correlation African HIV-uninfected patients with DM (controls) were
coefficient assessed the correlation between HbA1c and reviewed. People living with HIV and DM were significantly
electrolytes. Multinomial logistic regression assessed factors younger than HIV-uninfected patients with DM (median
associated with electrolyte abnormalities. Linear regression [IQR]: 46.5 [39–53.5] years vs. 56 [47–64] years; p < 0.001)
analyses assessed the effect of measured covariates on (Table 1). HIV-uninfected patients had a significantly longer
electrolytes. Multivariable models were stratified by HIV duration of DM compared with PLWH/DM (median [IQR]: 7
status and were adjusted for gender, age, use of TDF, type of [3–13] years vs. 5 [2–9] years; p = 0.006). People living with
DM, duration of DM, duration of HIV, HbA1c and eGFR. A HIV and DM had a median (IQR) duration of HIV of 7 (3–10)
two-tailed value of p < 0.05 was considered to indicate years and 86 (89.58%) patients were on ART, which included
statistical significance. 65 (67.7%) patients on TDF (Table 1). Eighty-four (87.5%)
PLWH/DM and 172 (89.58%) HIV-uninfected patients had
Ethical consideration type 2 DM. Seventy-three (76.0%) PLWH/DM and 153 (79.7%)
HIV-uninfected patients with DM had an HbA1c > 7%, which
Ethical approval to conduct the study was obtained from was considered uncontrolled. The median (IQR) HbA1c
the Biomedical Research and Ethics Committee (BREC) of amongst PLWH/DM and HIV-uninfected patients with DM
the University of KwaZulu-Natal (reference number was 9.45% (7.1% – 11.45%) and 9.70% (7.35% – 11.5%),
BE576/18). Permission was obtained from Edendale respectively (p = 0.836). An eGFR less than 60 mL/min/1.73m
2
hospital to utilise the DM clinic datasheet for data was present in 12 (12.5%) PLWH/DM and 24 (12.5%) HIV-
collection. uninfected patients with DM, respectively (Table1).
TABLE 1: Demographic and clinical characteristics of people living with human immunodeficiency virus and diabetes mellitus, and human immunodeficiency virus-
uninfected patients with diabetes mellitus.
Parameter PLWH/DM (n = 96) HIV-uninfected patients with DM (n = 192) p
n % IQR n % IQR
Age (years), median 46.5 - 39–53.5 56 - 47–64 < 0.001
Gender 1.000
Female 66 68.75 - 132 68.75 -
Male 30 31.25 - 60 31.25 -
Duration of DM (years), median 5 - 2–9 7 - 3–13 0.006
Duration of HIV (years), median 7 - 3–10 - - - -
Duration on ART (years), median 6 - 2–9 - - - -
Sodium (mmol/L), median 140 - 136.5–142 140 - 138–142 0.072
Potassium (mmol/L), median 4.35 - 3.90–4.70 4.3 - 3.90–4.70 0.903
Calcium (mmol/L), median 2.24 - 2.18–2.30 2.29 - 2.20–2.36 0.001
Phosphate (mmol/L), median 1.03 - 0.91–1.21 1.08 - 0.93–1.23 0.406
HbA1c (%), median 9.45 - 7.1–11.5 9.7 - 7.35–11.50 0.836
HbA1c > 7% 73 76.04 - 153 79.69 - 0.543
eGFR < 60 mL/min/1.73m 2 12 12.5 - 24 12.5 - 1.000
Diabetes type 0.691
Type 1 12 12.5 - 20 10.41 -
Type 2 84 87.5 - 172 89.58 -
Sodium 0.457
Hyponatraemia 18 18.75 - 26 13.54 -
Hypernatraemia 2 2.08 - 7 3.65 -
Potassium 0.851
Hypokalaemia 6 6.25 - 15 7.81 -
Hyperkalaemia 8 8.33 - 19 9.90 -
Calcium 0.292
Hypocalcaemia 30 31.25 - 44 22.91 -
Hypercalcaemia 1 1.04 - 3 1.56 -
Phosphate 0.959
Hypophosphataemia 5 5.21 - 12 6.25 -
Hyperphosphataemia 6 6.25 - 12 6.25 -
On ART 86 89.58 - - - - -
On TDF ART 65 67.71 - - - - -
Source: Edendale Hospital diabetes clinic datasheet
PLWH/DM, people living with human immunodeficiency virus and diabetes mellitus; HIV, human immunodeficiency virus; DM, diabetes mellitus; IQR, interquartile range; HbA1c, glycated
haemoglobin; eGFR, estimated glomerular filtration rate; ART, antiretroviral therapy; TDF, tenofovir.
http://www.sajhivmed.org.za 277 Open Access