
Page 287 - HIVMED_v21_i1.indb
P. 287
Page 5 of 8 Original Research
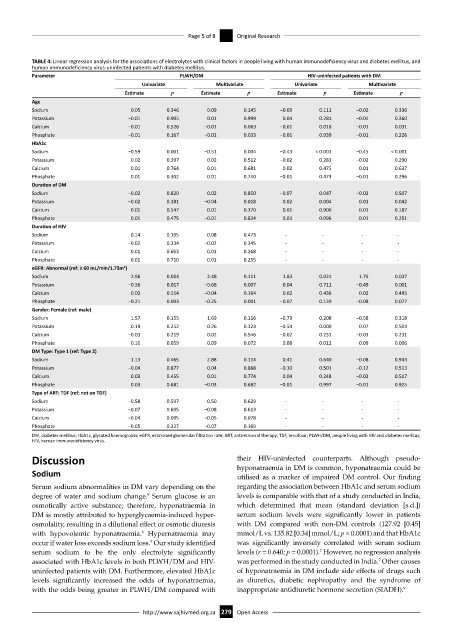
TABLE 4: Linear regression analysis for the associations of electrolytes with clinical factors in people living with human immunodeficiency virus and diabetes mellitus, and
human immunodeficiency virus-uninfected patients with diabetes mellitus.
Parameter PLWH/DM HIV-uninfected patients with DM
Univariate Multivariate Univariate Multivariate
Estimate p Estimate p Estimate p Estimate p
Age
Sodium 0.05 0.346 0.09 0.145 −0.03 0.111 −0.02 0.336
Potassium −0.01 0.905 0.01 0.999 0.04 0.281 −0.04 0.360
Calcium −0.01 0.526 −0.01 0.663 −0.01 0.018 −0.01 0.031
Phosphate −0.01 0.167 −0.01 0.033 −0.01 0.939 −0.01 0.226
HbA1c
Sodium −0.59 0.001 −0.51 0.004 −0.43 < 0.001 −0.45 < 0.001
Potassium 0.02 0.397 0.02 0.512 −0.02 0.283 −0.02 0.290
Calcium 0.01 0.764 0.01 0.681 0.02 0.475 0.01 0.637
Phosphate 0.01 0.302 0.01 0.740 −0.01 0.473 −0.01 0.296
Duration of DM
Sodium −0.02 0.820 0.02 0.850 −0.07 0.047 −0.02 0.507
Potassium −0.02 0.181 −0.04 0.018 0.02 0.004 0.01 0.042
Calcium 0.01 0.547 0.01 0.370 0.01 0.900 0.01 0.187
Phosphate 0.01 0.475 −0.01 0.834 0.03 0.096 0.01 0.251
Duration of HIV
Sodium 0.14 0.195 0.08 0.473 - - - -
Potassium −0.02 0.334 −0.02 0.345 - - - -
Calcium 0.01 0.653 0.01 0.268 - - - -
Phosphate 0.01 0.710 0.01 0.255 - - - -
eGFR: Abnormal (ref: ≥ 60 mL/min/1.73m ) 2
Sodium 2.96 0.054 2.48 0.111 1.83 0.024 1.75 0.037
Potassium −0.56 0.017 −0.68 0.007 0.04 0.711 −0.49 0.001
Calcium 0.02 0.514 −0.04 0.164 0.02 0.436 0.02 0.495
Phosphate −0.21 0.003 −0.25 0.001 −0.07 0.139 −0.08 0.077
Gender: Female (ref: male)
Sodium 1.57 0.155 1.69 0.116 −0.73 0.208 −0.58 0.318
Potassium 0.19 0.252 0.26 0.123 −0.54 0.000 0.07 0.504
Calcium −0.03 0.219 0.02 0.546 −0.02 0.231 −0.03 0.231
Phosphate 0.10 0.059 0.09 0.072 0.08 0.012 0.09 0.006
DM Type: Type 1 (ref: Type 2)
Sodium 1.13 0.465 2.88 0.114 0.41 0.640 −0.08 0.943
Potassium −0.04 0.877 0.04 0.888 −0.10 0.501 −0.12 0.513
Calcium 0.03 0.455 0.01 0.774 0.04 0.248 −0.02 0.517
Phosphate 0.03 0.681 −0.03 0.682 −0.01 0.997 −0.01 0.925
Type of ART: TDF (ref: not on TDF)
Sodium −0.58 0.597 0.50 0.629 - - - -
Potassium −0.07 0.695 −0.08 0.613 - - - -
Calcium −0.04 0.095 −0.05 0.078 - - - -
Phosphate −0.05 0.337 −0.07 0.169 - - - -
DM, diabetes mellitus; HbA1c, glycated haemoglobin; eGFR, estimated glomerular filtration rate; ART, antiretroviral therapy; TDF, tenofovir; PLWH/DM, people living with HIV and diabetes mellitus;
HIV, human immunodeficiency virus.
Discussion their HIV-uninfected counterparts. Although pseudo-
Sodium hyponatraemia in DM is common, hyponatraemia could be
utilised as a marker of impaired DM control. Our finding
Serum sodium abnormalities in DM vary depending on the regarding the association between HbA1c and serum sodium
9
degree of water and sodium change. Serum glucose is an levels is comparable with that of a study conducted in India,
osmotically active substance; therefore, hyponatraemia in which determined that mean (standard deviation [s.d.])
DM is mostly attributed to hyperglycaemia-induced hyper- serum sodium levels were significantly lower in patients
osmolality, resulting in a dilutional effect or osmotic diuresis with DM compared with non-DM controls (127.92 [0.45]
with hypovolemic hyponatraemia. Hypernatraemia may mmol/L vs. 135.82 [0.34] mmol/L; p = 0.0001) and that HbA1c
9
occur if water loss exceeds sodium loss. Our study identified was significantly inversely correlated with serum sodium
9
7
serum sodium to be the only electrolyte significantly levels (r = 0.640; p = 0.0001). However, no regression analysis
associated with HbA1c levels in both PLWH/DM and HIV- was performed in the study conducted in India. Other causes
7
uninfected patients with DM. Furthermore, elevated HbA1c of hyponatraemia in DM include side effects of drugs such
levels significantly increased the odds of hyponatraemia, as diuretics, diabetic nephropathy and the syndrome of
with the odds being greater in PLWH/DM compared with inappropriate antidiuretic hormone secretion (SIADH). 9
http://www.sajhivmed.org.za 279 Open Access