
Page 308 - SAHCS HIVMed Journal Vol 20 No 1 2019
P. 308
Page 4 of 7 Original Research
compared to the other groups (42 years, p < 0.001). The In total, 143 participants (26%) reported at least one
control group and the ART-naïve group had a high percentage respiratory symptom of which 128 participants (90%)
of current daily smokers (37% and 26%, respectively). Thirty- reported one symptom, 11 (8%) reported two symptoms, 3
four per cent HIV-positive participants reported a history of (2%) reported three symptoms and only one participant
a respiratory infection such as tuberculosis or pneumonia. reported all symptoms.
The numbers were especially high in the group on second-
In the unadjusted comparison across the four groups, the
line treatment (51%).
HIV-positive group on second-line ART had significantly
more respiratory symptoms compared to the HIV-negative
Occupational exposure was uncommon, with only 26 group (odds ratio [OR] 2.5, 95% confidence interval [CI]
participants (5%) reporting any exposure. Almost all 1.5–4.1) (Table 3). However, after adjustment for sex and
participants used gas or electricity for cooking (99.5%) and age, there was no difference in the frequency of respiratory
heating (99%). symptoms related to HIV or ART status. Further adjustment
for respiratory risk factors did not change this finding.
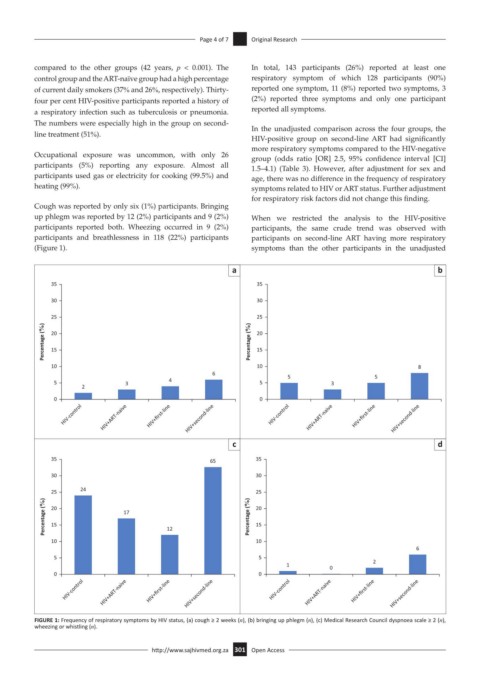
Cough was reported by only six (1%) participants. Bringing
up phlegm was reported by 12 (2%) participants and 9 (2%) When we restricted the analysis to the HIV-positive
participants reported both. Wheezing occurred in 9 (2%) participants, the same crude trend was observed with
participants and breathlessness in 118 (22%) participants participants on second-line ART having more respiratory
(Figure 1). symptoms than the other participants in the unadjusted
a b
35 35
30 30
25 25
Percentage (%) 20 Percentage (%) 20
15
15
10 10 8
6 5 5
5 3 4 5 3
2
0 0
HIV-control HIV+ART-naive HIV+first-line HIV+second-line HIV-control HIV+ART-naive HIV+first-line HIV+second-line
c d
35 65 35
30 30
25 24 25
Percentage (%) 20 17 12 Percentage (%) 20
15
15
10 10
6
5 5
1 0 2
0 0
HIV-control HIV+ART-naive HIV+first-line HIV+second-line HIV-control HIV+ART-naive HIV+first-line HIV+second-line
FIGURE 1: Frequency of respiratory symptoms by HIV status, (a) cough ≥ 2 weeks (n), (b) bringing up phlegm (n), (c) Medical Research Council dyspnoea scale ≥ 2 (n),
wheezing or whistling (n).
http://www.sajhivmed.org.za 301 Open Access