
Page 174 - SAHCS HIVMed Journal Vol 20 No 1 2019
P. 174
Page 5 of 8 Original Research
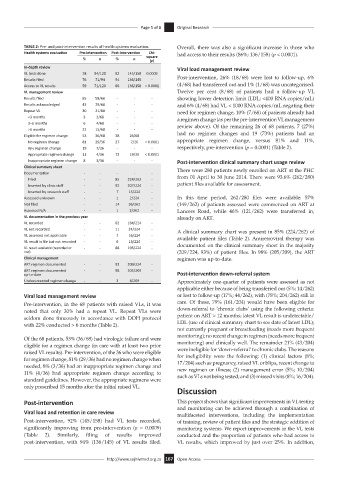
TABLE 2: Pre- and post-intervention results of health systems evaluation. Overall, there was also a significant increase in those who
Health systems evaluation Pre-intervention Post-intervention Chi- had access to their results (86%; 136/158) (p < 0.0001).
% n % n square
(p)
In-depth review Viral load management review
VL tests done 78 94/120 92 145/158 0.0009
Results filed 76 71/94 94 136/145 - Post-intervention, 26% (18/68) were lost to follow-up, 6%
Access to VL results 59 71/120 86 136/158 < 0.0001 (4/68) had transferred out and 1% (1/68) was uncategorised.
VL management review Twelve per cent (8/68) of patients had a follow-up VL
Results filed 85 58/68 - - - showing lower detection limit (LDL; <400 RNA copies/mL)
Results acknowledged 43 29/68 - - - and 6% (4/68) had VL < 1000 RNA copies/mL negating their
Repeat VL 30 21/68 - - - need for regimen change, 10% (7/68) of patients already had
<3 months 3 2/68 - - - a regimen change (as per the pre-intervention VL management
3–6 months 6 4/68 - - - review above). Of the remaining 26 of 68 patients, 7 (27%)
>6 months 22 15/68 - - -
Eligible for regimen change 53 36/68 38 26/68 had no regimen changes and 19 (73%) patients had an
No regimen change 81 29/36 27 7/26 < 0.0001 appropriate regimen change, versus 81% and 11%,
Any regimen change 19 7/36 - - - respectively, pre-intervention (p = 0.0001) (Table 2).
Appropriate regimen change 11 4/36 73 19/26 < 0.0001
Inappropriate regimen change 8 3/36 - - - Post-intervention clinical summary chart usage review
Clinical summary sheet There were 280 patients newly enrolled on ART at the PHC
Documentation - - - - -
Filed - - 85 224/262 - from 01 April to 30 June 2014. There were 93.6% (262/280)
Inserted by clinic staff - - 92 207/224 - patient files available for assessment.
Inserted by research staff - - 7 15/224 -
Assessed unknown - - 1 2/224 - In this time period, 262/280 files were available: 57%
Not filed - - 14 36/262 - (149/262) of patients assessed were commenced on ART at
Assessed N/A - - 1 2/262 - Lancers Road, while 46% (121/262) were transferred in,
VL documentation in the previous year already on ART.
VL recorded - - 82 184/224 -
VL not recorded - - 11 24/224 - A clinical summary chart was present in 85% (224/262) of
VL assessed not applicable - - 7 16/224 - available patient files (Table 2). Antiretroviral therapy was
VL result in file but not recorded - - 6 14/224 -
VL result available (recorded or - - 88 198/224 - documented on the clinical summary sheet in the majority
not) (209/224, 93%) of patient files. In 98% (205/209), the ART
Clinical management regimen was up-to-date.
ART regimen documented - - 93 209/224 -
ART regimen documented - - 98 205/209 -
up-to-date Post-intervention down-referral system
Undocumented regimen change - - 2 4/209 - Approximately one-quarter of patients were assessed as not
applicable either because of being transferred out (5%; 14/262)
Viral load management review or lost to follow-up (17%; 44/262), with (78%; 204/262) still in
Pre-intervention, in the 68 patients with raised VLs, it was care. Of these, 79% (161/204) would have been eligible for
noted that only 30% had a repeat VL. Repeat VLs were down-referral to ‘chronic clubs’ using the following criteria:
seldom done timeously in accordance with DOH protocol patient on ART > 12 months; latest VL result is undetectable/
with 22% conducted > 6 months (Table 2). LDL (use of clinical summary chart to see date of latest LDL);
not currently pregnant or breastfeeding (needs more frequent
monitoring); no recent change in regimen (needs more frequent
Of the 68 patients, 53% (36/68) had virologic failure and were
eligible for a regimen change (in care with at least two prior monitoring) and clinically well. The remainder 21% (43/204)
raised VL results). Pre-intervention, of the 36 who were eligible were ineligible for ‘down-referral’ to chronic clubs. The reasons
for regimen change, 81% (29/36) had no regimen change when for ineligibility were the following: (1) clinical factors (8%;
needed, 8% (3/36) had an inappropriate regimen change and 17/204) such as pregnancy, raised VL or blips, recent change to
11% (4/36) had appropriate regimen change according to new regimen or illness; (2) management error (5%; 10/204)
standard guidelines. However, the appropriate regimens were such as VLs not being tested; and (3) missed visits (8%; 16/204).
only prescribed 15 months after the initial raised VL.
Discussion
Post-intervention This project shows that significant improvements in VL testing
and monitoring can be achieved through a combination of
Viral load and retention in care review multifaceted interventions, including the implementation
Post-intervention, 92% (145/158) had VL tests recorded, of training, review of patient files and the strategic addition of
significantly improving from pre-intervention (p = 0.0009) monitoring systems. We report improvements in the VL tests
(Table 2). Similarly, filing of results improved conducted and the proportion of patients who had access to
post-intervention, with 94% (136/145) of VL results filed. VL results, which improved by just over 25%. In addition,
http://www.sajhivmed.org.za 167 Open Access