
Page 130 - SAHCS HIVMed Journal Vol 20 No 1 2019
P. 130
Page 6 of 9 Original Research
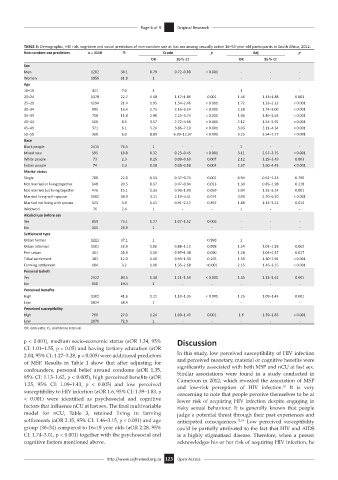
TABLE 3: Demographic, HIV risk, cognitive and social predictors of non-condom use at last sex among sexually active 16–55-year-old participants in South Africa, 2012.
Non-condom use predictors n = 3158 % Crude p Adj p
OR 95% CI OR 95% CI
Sex
Men 1202 38.1 0.79 0.72–0.88 < 0.001 - - -
Women 1956 61.9 1 - - - - -
Age
16–19 421 7.0 1 - - 1 - -
20–24 1378 22.7 1.48 1.17–1.86 0.001 1.46 1.13–1.88 0.003
25–29 1294 21.4 1.95 1.54–2.46 < 0.001 1.72 1.33–2.22 < 0.001
30–34 995 16.4 2.75 2.16–3.24 < 0.001 2.28 1.74–3.00 < 0.001
35–39 718 11.8 2.90 2.25–3.74 < 0.001 1.96 1.46–2.63 < 0.001
40–44 516 8.5 3.57 2.72–4.68 < 0.001 2.12 1.54–2.92 < 0.001
45–49 371 6.1 5.24 3.86–7.10 < 0.001 3.03 2.11–4.34 < 0.001
50–55 368 6.0 8.89 6.39–12.97 < 0.001 5.25 3.54–7.77 < 0.001
Race
Black people 2415 76.5 1 - - 1 - -
Mixed race 595 18.8 0.32 0.23–0.45 < 0.001 3.11 2.57–3.75 < 0.001
White people 73 2.3 0.25 0.09–0.69 0.007 2.12 1.29–3.49 0.003
Indian people 74 2.3 0.18 0.05–0.58 0.004 2.67 1.60–4.45 < 0.001
Marital status
Single 700 22.0 0.53 0.37–0.74 0.001 0.94 0.62–1.43 0.790
Not married or living together 648 20.5 0.67 0.47–0.94 0.023 1.30 0.85–1.98 0.218
Not married but living together 476 15.1 1.33 0.93–1.90 0.069 2.04 1.32–3.14 0.001
Married living with spouse 1102 38.9 3.11 2.19–4.41 0.074 4.09 2.70–6.20 < 0.001
Married not living with spouse 123 3.9 1.41 0.91–2.17 0.897 1.88 1.13–3.12 0.014
Widowed 76 2.4 1 - - 1 - -
Alcohol use before sex
Yes 859 73.1 1.27 1.07–1.52 0.006 - - -
No 315 26.9 1 - - - - -
Settlement type
Urban formal 1211 37.1 1 - 0.998 1 - -
Urban informal 1101 26.9 1.00 0.88–1.12 0.998 1.24 1.01–1.55 0.002
Peri-urban 361 35.9 1.16 0.97–1.38 0.090 1.28 1.04–1.57 0.017
Tribal settlement 381 12.0 1.10 0.93–1.30 0.265 1.59 1.30–1.94 < 0.001
Farming settlement 104 3.2 1.90 1.35–2.68 <0.001 2.15 1.46–3.15 < 0.001
Personal beliefs
Yes 2522 80.5 1.38 1.21–1.59 < 0.001 1.35 1.13–1.62 0.001
No 610 19.4 1 - - - - -
Perceived benefits
High 1302 41.6 1.22 1.10–1.35 < 0.001 1.25 1.09–1.43 0.001
Low 1824 58.4 1 - - - - -
Perceived susceptibility
High 766 27.0 1.24 1.09–1.40 0.001 1.6 1.39–1.83 < 0.001
Low 2070 72.9 1 - - - - -
OR, odds ratio; CI, confidence interval.
p < 0.001), medium socio-economic status (aOR 1.24, 95% Discussion
CI: 1.01–1.55, p = 0.05) and having tertiary education (aOR
2.04, 95% CI: 1.27–3.28, p < 0.005) were additional predictors In this study, low perceived susceptibility of HIV infection
of MSP. Results in Table 1 show that after adjusting for and perceived monetary, material or cognitive benefits were
confounders, personal belief around condoms (aOR 1.35, significantly associated with both MSP and nCU at last sex.
95% CI: 1.13–1.62, p < 0.005), high perceived benefits (aOR Similar associations were found in a study conducted in
Cameroon in 2012, which revealed the association of MSP
1.25, 95% CI: 1.09–1.43, p < 0.005) and low perceived and low-risk perception of HIV infection. It is very
16
susceptibility to HIV infection (aOR 1.6, 95% CI: 1.39–1.83, p concerning to note that people perceive themselves to be at
< 0.001) were identified as psychosocial and cognitive lower risk of acquiring HIV infection despite engaging in
factors that influence nCU at last sex. The final multivariable risky sexual behaviour. It is generally known that people
model for nCU, Table 3, retained living in farming judge a potential threat through their past experiences and
settlements (aOR 2.15, 95% CI: 1.46–3.15, p < 0.001) and age anticipated consequences. 12,18 Low perceived susceptibility
group (30–34) compared to 16–19 year olds (aOR 2.28, 95% could be partially attributed to the fact that HIV and AIDS
CI: 1.74–3.01, p < 0.001) together with the psychosocial and is a highly stigmatised disease. Therefore, when a person
cognitive factors mentioned above. acknowledges his or her risk of acquiring HIV infection, he
http://www.sajhivmed.org.za 123 Open Access