Page 129 - SAHCS HIVMed Journal Vol 20 No 1 2019
P. 129

Page 5 of 9  Original Research


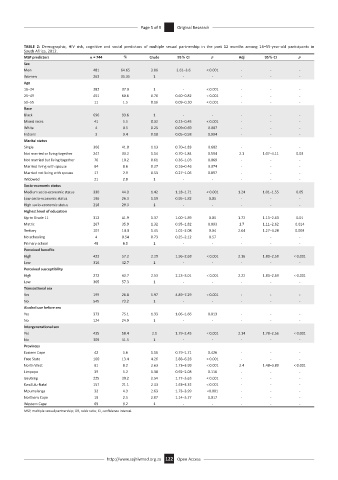
              TABLE  2:  Demographic,  HIV  risk,  cognitive  and  social  predictors  of  multiple  sexual  partnership  in  the  past  12  months  among  16–55-year-old  participants  in
              South Africa, 2012.
              MSP predictors         n = 744     %        Crude     95% CI      p        Adj      95% CI      p
              Sex
              Men                     481       64.65     3.06     2.61–3.6   < 0.001     -         -         -
              Women                   263       35.35      1          -         -         -         -         -
              Age
              16–24                   282       37.9       1          -       < 0.001     -         -         -
              25–49                   451       60.6      0.70     0.60–0.82  < 0.001     -         -         -
              50–55                   11        1.5       0.16     0.09–0.30  < 0.001     -         -         -
              Race
              Black                   696       93.6       1          -         -         -         -         -
              Mixed races             41        5.5       0.32     0.23–0.45  < 0.001     -         -         -
              White                    4        0.5       0.25     0.09–0.69  0.007       -         -         -
              Indians                  3        0.4       0.18     0.05–0.58  0.004       -         -         -
              Marital status
              Single                  306       41.0      1.13     0.70–1.83  0.602       -         -         -
              Not married or living together  247   33.2  1.14     0.70–1.84  0.594      2.1      1.07–4.11  0.03
              Not married but living together  76   10.2  0.61     0.36–1.03  0.069       -         -         -
              Married living with spouse  64    8.6       0.27     0.16–0.46  0.074       -         -         -
              Married not living with spouse  17   2.3    0.53     0.27–1.06  0.897       -         -         -
              Widowed                 21        2.8        1          -         -         -         -         -
              Socio-economic status
              Medium socio-economic status  330   44.3    1.42     1.18–1.71  < 0.001    1.24     1.01–1.55  0.05
              Low socio-economic status  196    26.3      1.19     0.95–1.82   0.05       -         -         -
              High socio-economic status  218   29.3       1          -         -         -         -         -
              Highest level of education
              Up to Grade 11          312       41.9      1.37     1.00–1.89   0.05      1.72     1.13–2.63  0.01
              Matric                  267       35.9      1.32     0.95–1.82  0.093      1.7      1.11–2.62  0.014
              Tertiary                107       14.4      1.45     1.01–2.08   0.04      2.04     1.27–3.28  0.003
              No schooling             4        0.54      0.73     0.25–2.12   0.57       -         -         -
              Primary school          48        6.5        1          -         -         -         -         -
              Perceived benefits
              High                    423       57.2      2.29     1.96–2.68  < 0.001    2.16     1.80–2.58  < 0.001
              Low                     316       42.7       1          -         -         -         -         -
              Perceived susceptibility
              High                    272       42.7      2.53     2.13–3.01  < 0.001    2.22     1.83–2.69  < 0.001
              Low                     365       57.3       1          -         -         -         -         -
              Transactional sex
              Yes                     199       26.8      5.97     4.89–7.29  < 0.001     -         -         -
              No                      545       73.2       1          -         -         -         -         -
              Alcohol use before sex
              Yes                     373       75.1      1.33     1.06–1.66  0.013       -         -         -
              No                      124       24.9       1          -         -         -         -         -
              Intergenerational sex
              Yes                     435       58.4       2.1     1.79–2.45  < 0.001    2.14     1.78–2.56  < 0.001
              No                      309       41.5       1          -         -         -         -         -
              Provinces
              Eastern Cape            42        5.6       1.16     0.79–1.71  0.426       -         -         -
              Free State              100       13.4      4.26     2.88–6.28  < 0.001     -         -         -
              North West              61        8.2       2.63     1.73–3.99  < 0.001    2.4      1.48–3.89  < 0.001
              Limpopo                 39        5.2       1.38     0.92–2.08  0.116       -         -         -
              Gauteng                 225       30.2      2.54     1.77–3.63  < 0.001     -         -         -
              KwaZulu-Natal           157       21.1      2.33     1.63–3.32  < 0.001     -         -         -
              Mpumalanga              32        4.3       2.63     1.73–3.99  <0.001      -         -         -
              Northern Cape           19        2.5       2.07     1.14–3.77  0.017       -         -         -
              Western Cape            69        9.2        1          -         -         -         -         -
              MSP, multiple sexual partnership; OR, odds ratio; CI, confidence interval.


                                           http://www.sajhivmed.org.za 122  Open Access
   124   125   126   127   128   129   130   131   132   133   134