
Page 180 - SAHCS HIVMed Journal Vol 20 No 1 2019
P. 180
Page 3 of 6 Original Research
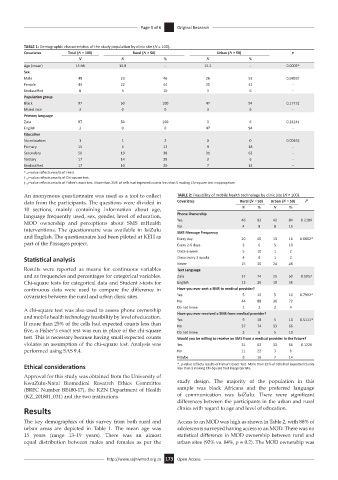
TABLE 1: Demographic characteristics of the study population by clinic site (N = 100).
Covariates Total (N = 100) Rural (N = 50) Urban (N = 50) p
N N % N %
Age (mean) 15.98 16.8 - 15.2 - 0.0002*
Sex
Male 49 23 46 26 52 0.6859†
Female 43 22 44 21 42 -
Unclassified 8 5 10 3 6 -
Population group
Black 97 50 100 47 94 0.1775‡
Mixed race 3 0 0 3 6 -
Primary language
Zulu 97 50 100 3 6 0.2424‡
English 3 0 0 47 94 -
Education
No education 1 1 2 0 0 0.0049‡
Primary 15 6 12 9 18 -
Secondary 50 19 38 31 62 -
Tertiary 17 14 28 3 6 -
Unclassified 17 10 20 7 14 -
*, p-value reflects results of t-test.
†, p-value reflects results of Chi-square test.
‡, p-value reflects results of Fisher’s exact test. More than 25% of cells had expected counts less than 5 making Chi-square test inappropriate.
An anonymous questionnaire was used as a tool to collect TABLE 2: Feasibility of mobile health technology by clinic site (N = 100).
data from the participants. The questions were divided in Covariates Rural (N = 50) Urban (N = 50) P
10 sections, mainly containing information about age, N % N %
language frequently used, sex, gender, level of education, Phone Ownership
MOD ownership and perceptions about SMS mHealth Yes 46 92 42 84 0.2184
No
16
8
8
4
interventions. The questionnaire was available in IsiZulu SMS Message Frequency
and English. The questionnaire had been piloted at KEH as Every day 20 40 13 16 0.0802*
part of the Passages project. Every 2-6 days 3 6 5 10
Once a week 5 10 1 2
Statistical analysis Once every 2 weeks 4 8 1 2
Never 15 30 24 48
Results were reported as means for continuous variables Text Language
and as frequencies and percentages for categorical variables. Zulu 37 74 25 50 0.1057
Chi-square tests for categorical data and Student t-tests for English 13 26 18 36
continuous data were used to compare the difference in Have you ever sent a SMS to medical provider?
covariates between the rural and urban clinic sites. Yes 5 10 5 10 0.7992*
No 44 88 36 72
Do not know 1 2 2 4
A chi-square test was also used to assess phone ownership
and mobile health technology feasibility by level of education. Have you ever received a SMS from medical provider? 5 10 0.5111*
Yes
18
9
If more than 25% of the cells had expected counts less than No 37 74 33 66
five, a Fisher’s exact test was run in place of the chi-square Do not know 3 6 5 10
test. This is necessary because having small expected counts Would you be willing to receive an SMS from a medical provider in the future?
violates an assumption of the chi-square test. Analysis was Yes 31 62 33 66 0.1226
performed using SAS 9.4. No 11 22 3 6
Maybe 8 16 7 14
Ethical considerations *, p-value reflects results of Fisher’s Exact Test. More than 25% of cells had expected counts
less than 5 making Chi-Square Test inappropriate.
Approval for this study was obtained from the University of
KwaZulu-Natal Biomedical Research Ethics Committee study design. The majority of the population in this
(BREC Number BE480-17), the KZN Department of Health sample was black Africans and the preferred language
(KZ_201801_031) and the two institutions. of communication was IsiZulu. There were significant
differences between the participants in the urban and rural
Results clinics with regard to age and level of education.
The key demographics of this survey from both rural and Access to an MOD was high as shown in Table 2, with 88% of
urban areas are depicted in Table 1. The mean age was adolescents surveyed having access to an MOD. There was no
15 years (range 13–19 years). There was an almost statistical difference in MOD ownership between rural and
equal distribution between males and females as per the urban sites (92% vs. 84%, p = 0.2). The MOD ownership was
http://www.sajhivmed.org.za 173 Open Access