
Page 137 - SAHCS HIVMed Journal Vol 20 No 1 2019
P. 137
Page 4 of 7 Original Research
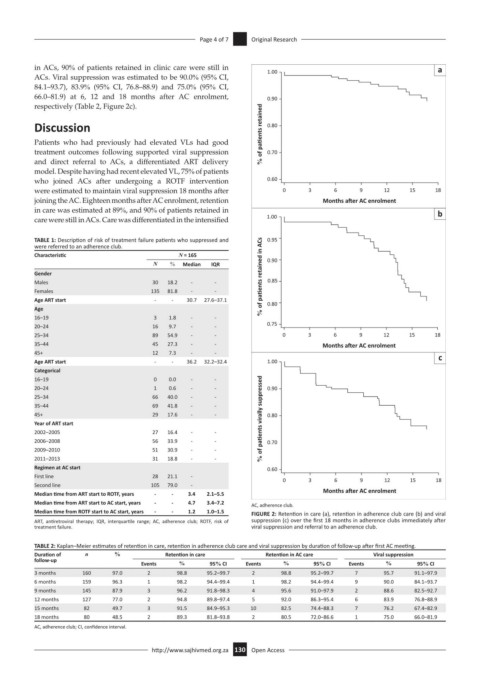
in ACs, 90% of patients retained in clinic care were still in 1.00 a
ACs. Viral suppression was estimated to be 90.0% (95% CI,
84.1–93.7), 83.9% (95% CI, 76.8–88.9) and 75.0% (95% CI,
66.0–81.9) at 6, 12 and 18 months after AC enrolment, 0.90
respectively (Table 2, Figure 2c).
Discussion 0.80
Patients who had previously had elevated VLs had good % of pa ents retained
treatment outcomes following supported viral suppression 0.70
and direct referral to ACs, a differentiated ART delivery
model. Despite having had recent elevated VL, 75% of patients
who joined ACs after undergoing a ROTF intervention 0.60
were estimated to maintain viral suppression 18 months after 0 3 6 9 12 15 18
joining the AC. Eighteen months after AC enrolment, retention Months a er AC enrolment
in care was estimated at 89%, and 90% of patients retained in b
care were still in ACs. Care was differentiated in the intensified 1.00
TABLE 1: Description of risk of treatment failure patients who suppressed and 0.95
were referred to an adherence club.
Characteristic N = 165
N % Median IQR 0.90
Gender % of pa ents retained in ACs
Males 30 18.2 - - 0.85
Females 135 81.8 - -
Age ART start - - 30.7 27.6–37.1 0.80
Age
16–19 3 1.8 - -
20–24 16 9.7 - - 0.75
25–34 89 54.9 - - 0 3 6 9 12 15 18
35–44 45 27.3 - - Months a er AC enrolment
45+ 12 7.3 - - c
Age ART start - - 36.2 32.2–32.4 1.00
Categorical
16–19 0 0.0 - -
20–24 1 0.6 - - 0.90
25–34 66 40.0 - -
35–44 69 41.8 - -
45+ 29 17.6 - - 0.80
Year of ART start % of pa ents virally suppressed
2002–2005 27 16.4 - -
2006–2008 56 33.9 - - 0.70
2009–2010 51 30.9 - -
2011–2013 31 18.8 - -
Regimen at AC start 0.60
First line 28 21.1 - 0 3 6 9 12 15 18
Second line 105 79.0 -
Median time from ART start to ROTF, years - - 3.4 2.1–5.5 Months a er AC enrolment
Median time from ART start to AC start, years - - 4.7 3.4–7.2 AC, adherence club.
Median time from ROTF start to AC start, years - - 1.2 1.0–1.5 FIGURE 2: Retention in care (a), retention in adherence club care (b) and viral
ART, antiretroviral therapy; IQR, interquartile range; AC, adherence club; ROTF, risk of suppression (c) over the first 18 months in adherence clubs immediately after
treatment failure. viral suppression and referral to an adherence club.
TABLE 2: Kaplan–Meier estimates of retention in care, retention in adherence club care and viral suppression by duration of follow-up after first AC meeting.
Duration of n % Retention in care Retention in AC care Viral suppression
follow-up
Events % 95% CI Events % 95% CI Events % 95% CI
3 months 160 97.0 2 98.8 95.2–99.7 2 98.8 95.2–99.7 7 95.7 91.1–97.9
6 months 159 96.3 1 98.2 94.4–99.4 1 98.2 94.4–99.4 9 90.0 84.1–93.7
9 months 145 87.9 3 96.2 91.8–98.3 4 95.6 91.0–97.9 2 88.6 82.5–92.7
12 months 127 77.0 2 94.8 89.8–97.4 5 92.0 86.3–95.4 6 83.9 76.8–88.9
15 months 82 49.7 3 91.5 84.9–95.3 10 82.5 74.4–88.3 7 76.2 67.4–82.9
18 months 80 48.5 2 89.3 81.8–93.8 2 80.5 72.0–86.6 1 75.0 66.0–81.9
AC, adherence club; CI, confidence interval.
http://www.sajhivmed.org.za 130 Open Access